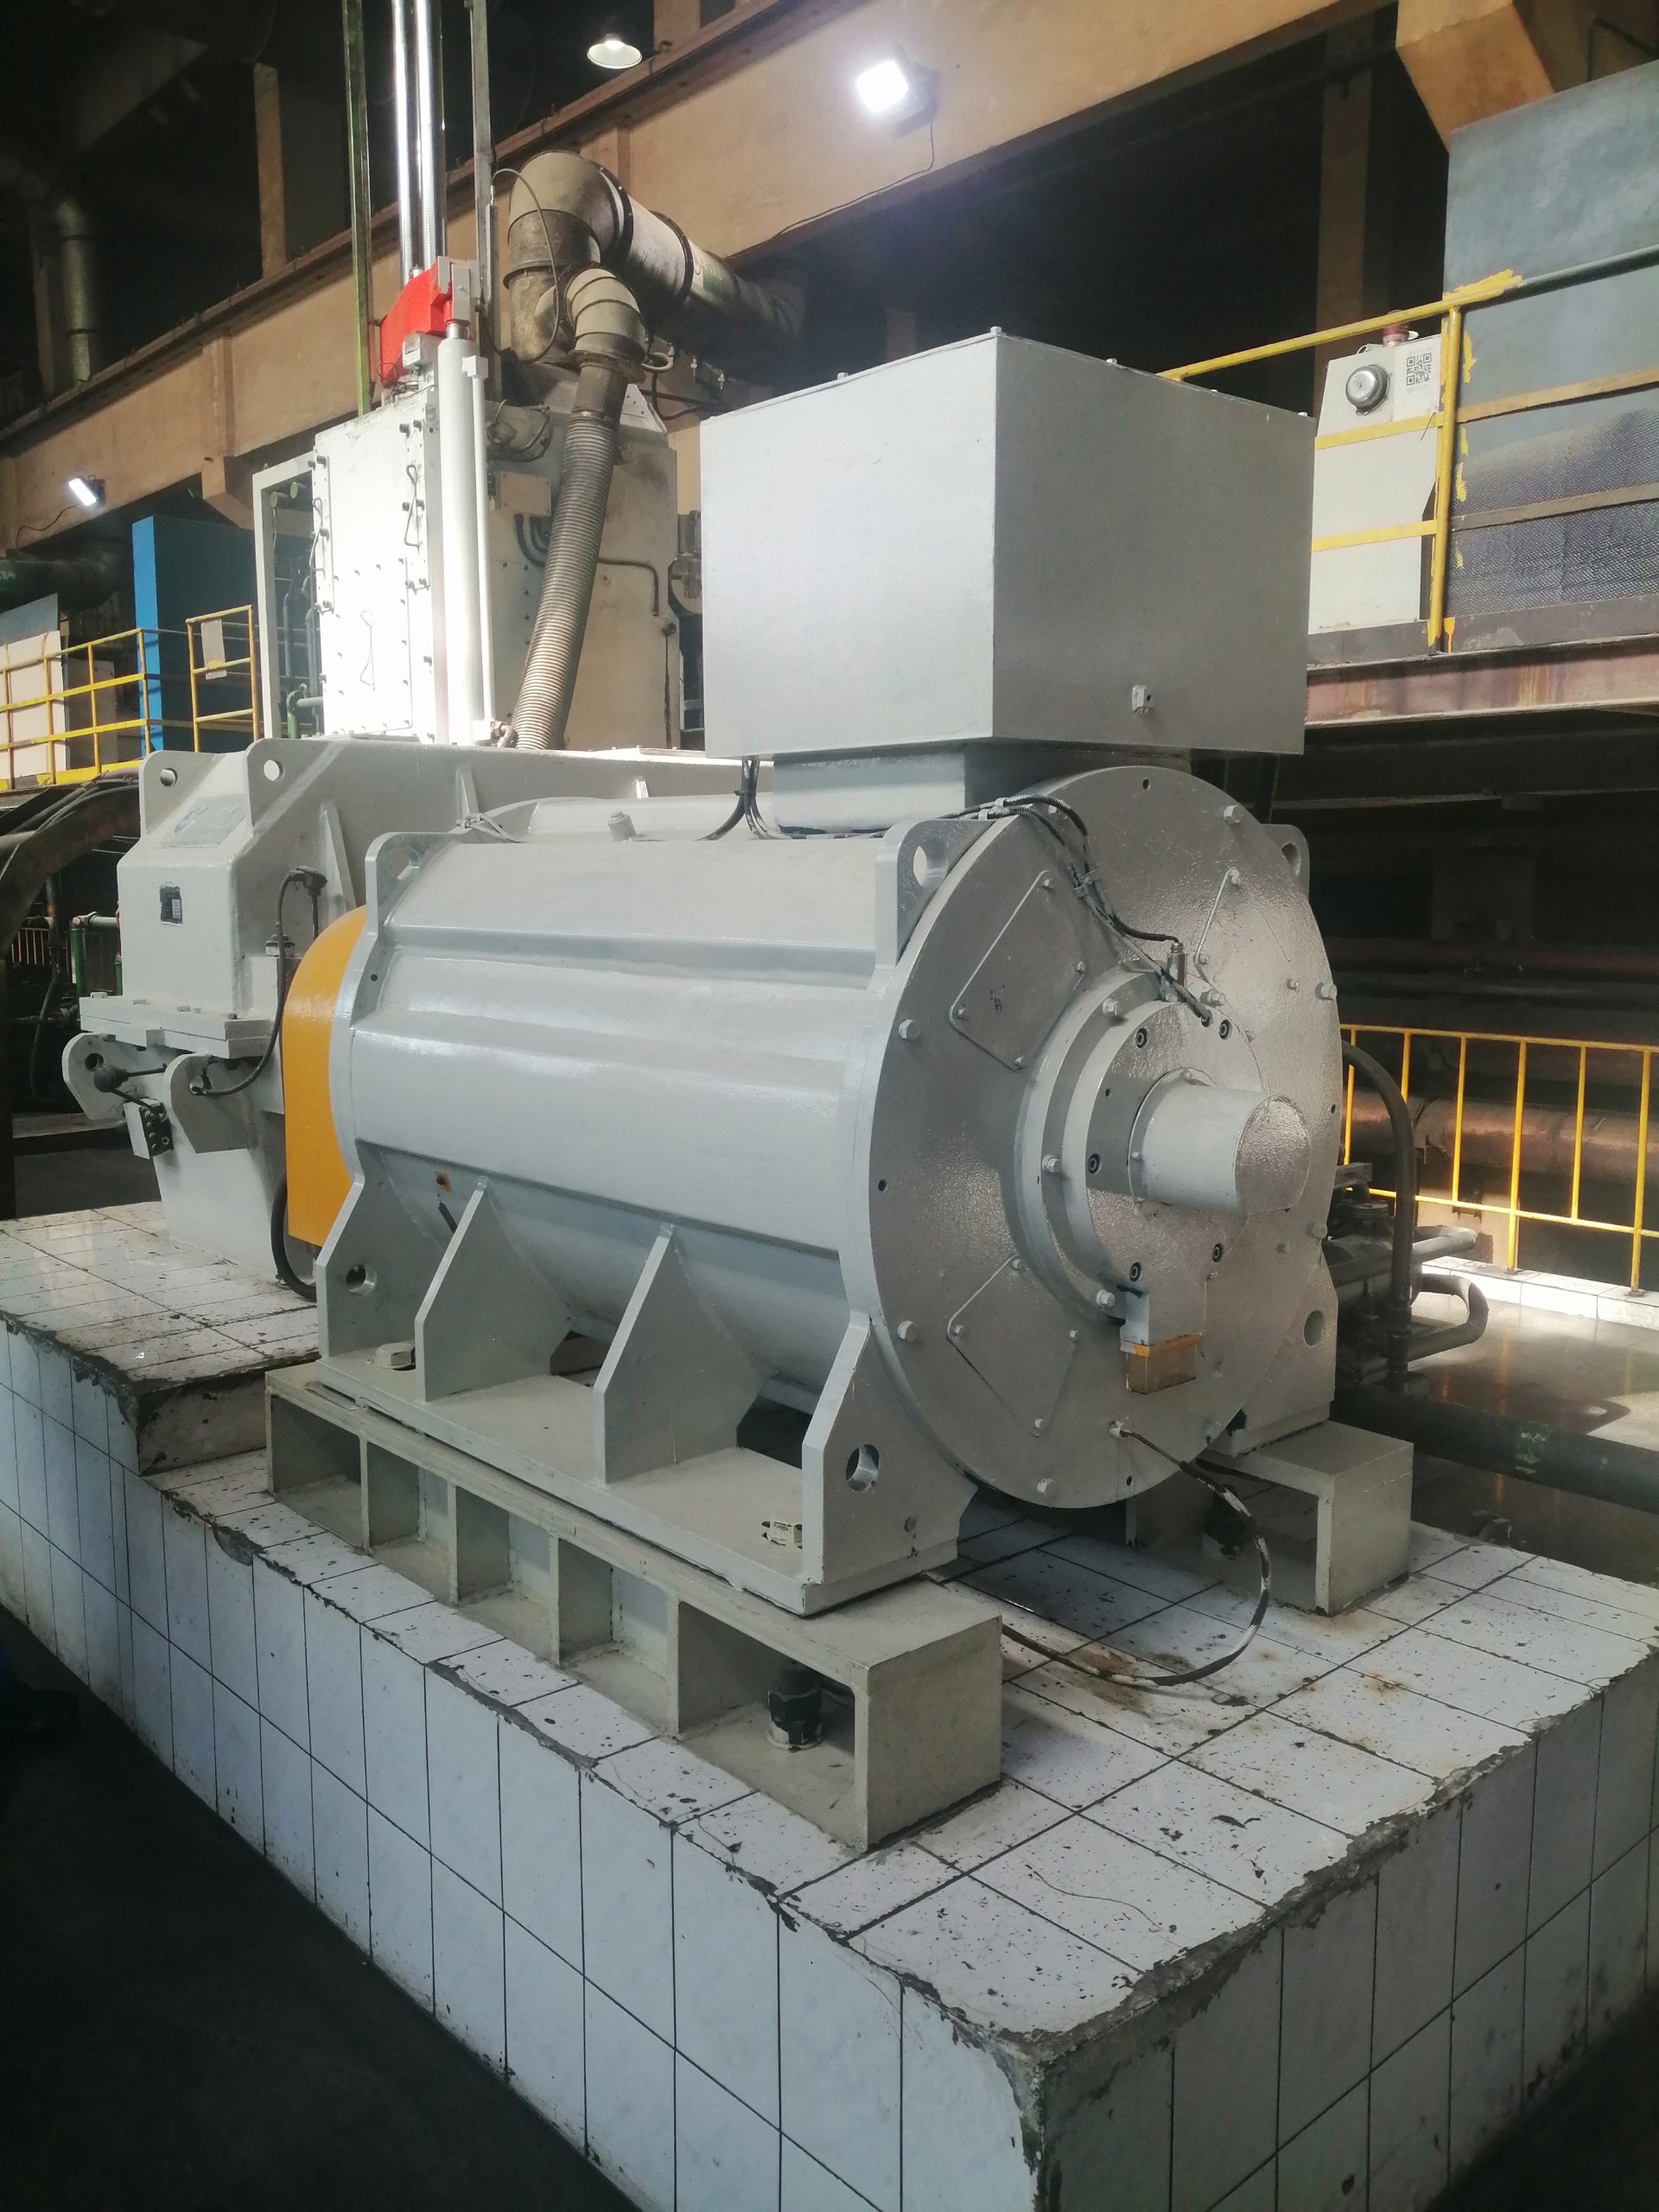
PMSM torque-speed curve review is the quickest way to expose a motor-selection mistake before equipment is ordered. A single rated-power value hides the continuous torque limit, the short-duration peak region, the voltage-limited speed range, and the cooling conditions behind each boundary. Engineers should therefore request the curve for the proposed motor and drive combination, then place every real operating point on it. This guide explains what the regions mean, which inputs change them, and what evidence should be attached to an industrial RFQ.
Read the axes before reading the headline rating
A torque-speed graph normally puts shaft speed on the horizontal axis and available torque on the vertical axis. The important word is available. The curve is not automatically a process-demand curve, and it is not a promise that every point beneath a line can be held forever. Ask whether each line represents continuous duty, a temporary overload, a drive-current limit, or a mechanical speed limit. Confirm the ambient temperature, cooling method, DC-bus condition, and winding temperature assumed when the graph was created.
Translate the driven machine into the same coordinates. For each production state, record speed, required torque, time at that point, and the transition into and out of it. Add starts, reversals, braking, jam release, and any period of torque at very low speed. The U.S. Department of Energy explains that variable-speed savings and equipment behavior depend on the load duty cycle rather than one nominal point in its Adjustable Speed Drive Part-Load Efficiency guidance. The same discipline applies when validating the motor envelope.
Separate continuous torque from peak torque
Continuous torque is constrained mainly by heat rejection and allowable temperature rise. Copper, iron, mechanical, and drive-related losses change across the speed-load map. At low shaft speed, a shaft-mounted fan may move less air; at high electrical frequency, iron and switching-related effects may become more important. A supplier should state the continuous boundary for the actual cooling arrangement, not merely reproduce a catalog curve from another enclosure or frame.
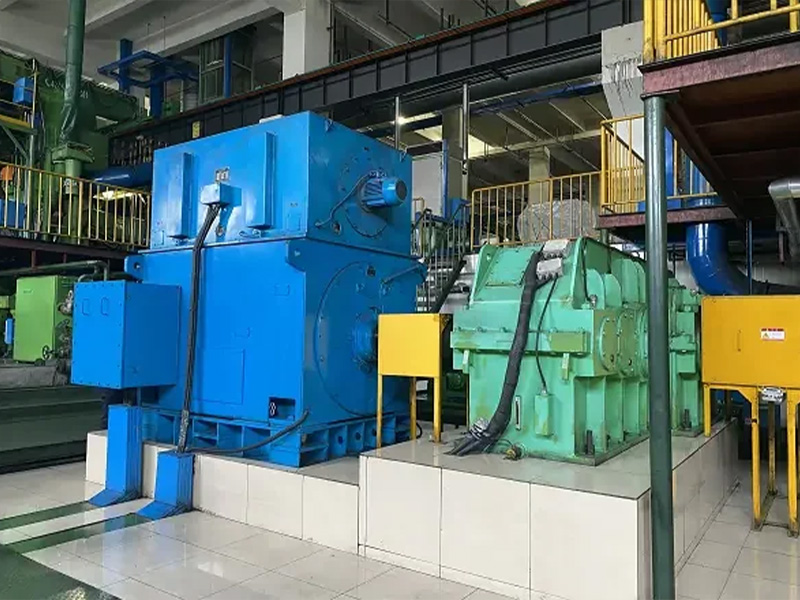
Peak torque is time-limited. Its permissible duration and repetition rate depend on motor temperature before the event, drive current, magnetic design, mechanical stress, and the recovery time between events. Put a duration beside every peak requirement. “Two times torque” is incomplete if the application needs it for two seconds on a cold start, thirty seconds during acceleration, or repeatedly in a cyclic process. Ask the supplier to show how the proposed duty was thermally evaluated and which protective limit prevents repeated peaks from becoming a continuous overload.
Understand base speed and the voltage-limited region
Below base speed, a properly matched drive may be able to control current so the motor delivers a constant-torque region within its thermal and current limits. As speed rises, the required counter-electromotive force approaches the voltage available from the inverter. The system then reaches a boundary where maintaining the same flux and torque is no longer possible. Base speed is therefore a property of the motor, winding, DC bus, modulation, and control strategy considered together.
Do not assume that the mechanical maximum speed equals the highest speed at full torque. Rockwell Automation's official description of a PM motor torque-speed curve and field weakening distinguishes rated speed, maximum speed, continuous torque, and peak torque. It also explains why active current-vector control is used above the normal voltage region. Use that source as a general control reference; the limits for a project must come from the chosen motor and inverter.
Treat field weakening as a controlled operating mode
Field weakening extends speed by commanding current that reduces the effective magnetic field seen by the stator. Torque capacity generally falls as speed rises because voltage and current remain limited. The phrase does not mean the permanent magnets are physically weakened during normal operation. It describes a drive-control action, and it requires a controller that supports the exact motor type and has the data needed to maintain stable current control.
The safety case also changes above base speed. If the inverter is disabled while an externally driven load keeps the rotor turning, generated voltage can rise because active field-weakening current disappears. Ask how the drive handles overspeed, coasting, back-driving, emergency stops, and loss of feedback. Define whether a braking resistor, regenerative front end, mechanical brake, isolation device, or process action is part of the response. The answers belong in the motor-drive functional description and the commissioning test plan.
Overlay the process duty and check thermal recovery
Plot the required operating points rather than comparing two lists of numbers. A conveyor may need breakaway torque at zero or low speed, a mixer may move through changing viscosity, and a pump may spend most of its time below rated flow. Connect the points in the order the machine actually follows. This reveals whether an acceleration crosses the peak envelope, whether a dwell traps heat at low airflow, and whether regenerative deceleration occurs in a voltage-sensitive region.

Then calculate or simulate the complete cycle. A point inside the peak curve can still be unacceptable when it repeats too often. Conversely, a short excursion above the continuous line may be acceptable when the motor begins cool and has enough recovery time. Record the assumed initial temperature, cycle length, load inertia, acceleration time, and cooling availability. The PMSM selection guide provides a broader list of environmental and mechanical inputs that should travel with this duty map.
Confirm the drive, feedback, and protection boundaries
The curve is valid only with a stated inverter configuration. Provide supply voltage and tolerance, drive model and current rating, switching conditions, motor cable length, output filters, and feedback method. If sensorless control is proposed, define the required low-speed torque and speed accuracy. If an encoder or resolver is used, identify its interface, mounting, cable, and fault response. A general claim that a drive “supports PMSM” is not enough to establish the published envelope.
Agree on current limit, winding-temperature protection, bearing-temperature alarms where applicable, overspeed action, stall detection, and cooling-loss response. Save the final drive parameters after commissioning. A later replacement or firmware change can alter control behavior even if the motor nameplate stays the same. For a deeper compatibility review, use the PMSM VFD checklist and require both suppliers to sign the same torque-speed and protection schedule.
Build acceptance tests around measurable operating points
Factory tests should identify which points can be reproduced and which depend on the customer's driven equipment. At minimum, preserve the motor data sheet, curve revision, test method, instrument list, temperature condition, and tolerances. A no-load run verifies rotation and basic control, but it does not prove continuous torque or thermal performance. If full-load testing is impractical at the factory, agree on calculations, partial tests, and a site test that closes the gap.
At site, progress from static checks to controlled low-speed rotation, then to defined load points. Record speed, current, DC-bus behavior, temperatures, vibration, alarms, and process output. Hold continuous points long enough to apply the agreed stabilization rule. Test peak events at the approved duration and repetition rate. Archive the results with the exact motor, drive, firmware, and parameter versions so a future engineer can tell what was actually accepted.
Send a decision-ready curve request
An effective request includes the process torque-speed table; continuous and peak duration; inertia and acceleration; maximum back-driving speed; supply and drive data; ambient, altitude, enclosure, and cooling; shaft and mounting drawings; and acceptance criteria. Ask the supplier to return a continuous curve, a peak curve with time limits, a maximum-speed boundary, and written assumptions. Unknown inputs should be listed as open items instead of filled with convenient defaults.
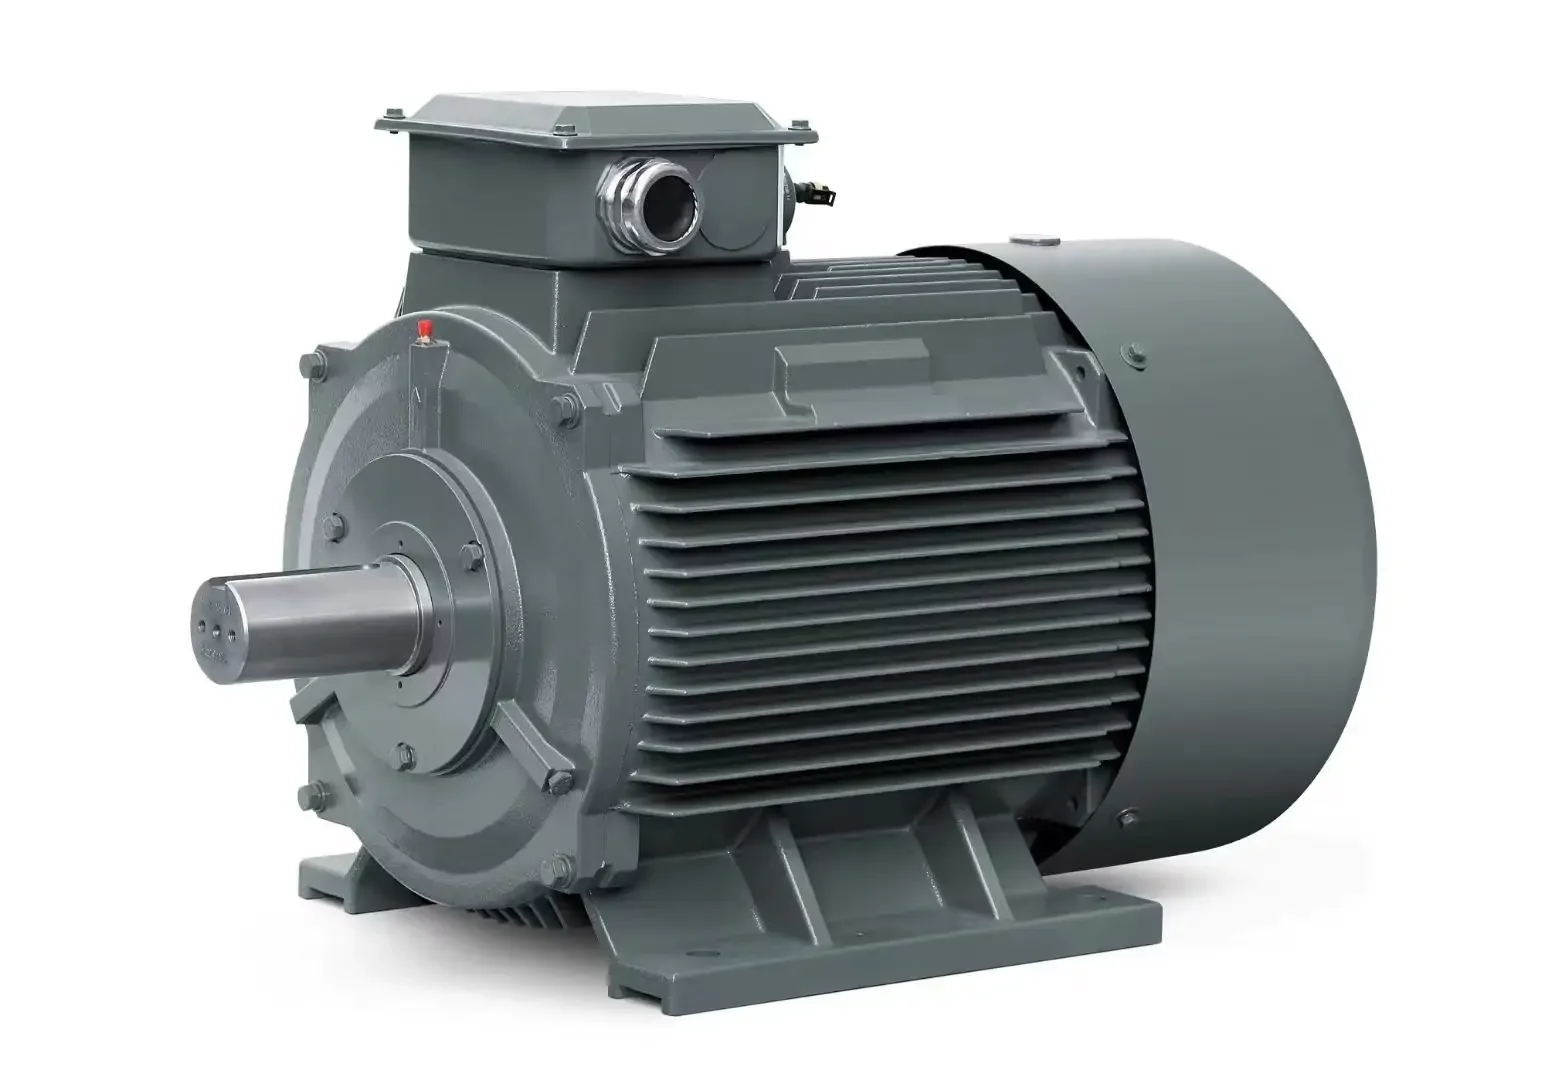
ENNENG's archived sources identify permanent-magnet motor R&D and manufacturing activity and TYB, TYP, and TYPCX family categories. Those records correspond to knowledge references ENNENG-CAND-002, ENNENG-CAND-003, ENNENG-CAND-004, and ENNENG-CAND-005. They establish product-family context only; they do not establish a universal torque-speed curve or field-weakening limit. Review the motor series overview, then send the actual duty to request a project-specific curve and controlled data sheet.
Evidence boundary
The company-source statements in this article are limited to the existence of ENNENG's permanent-magnet motor activity and archived motor-family categories. Conflicting legacy fields are not repeated as performance claims. General engineering context comes from the official DOE variable-speed-drive tip sheet and Rockwell Automation control documentation linked above. Neither source certifies an ENNENG product, drive pairing, or application result. Final selection requires the proposed motor data, inverter instructions, thermal assessment, interface drawings, and acceptance record.